

Monitoring Dashboard
The Monitoring section is a live dashboard of charts and grids for the server behind a connection — transaction rate, backends, WAL production, database size, cache hit ratios and more — built from small, independent cards called Monitoring Units. Besides the units that come with OmniDB you can write your own, each one a single SQL query.
Built-in units exist for PostgreSQL (16 units) and MySQL (1 unit, Thread Count). MariaDB and Oracle connections get the dashboard too, for your own custom units. For other engines the section shows Monitoring is not supported for … connections.
Opening the dashboard
Click the Monitoring icon in the left rail (between Database and Notify). The dashboard belongs to a connection that is open in the Database section: the strip of open connection tabs is shown at the top of the section, and selecting a tab shows that connection's dashboard. With no connection open it shows No connection open.
All units start paused when the dashboard loads, so opening it does not start querying the server by itself. Start the ones you want with their own play button, or all of them at once with Enable All.
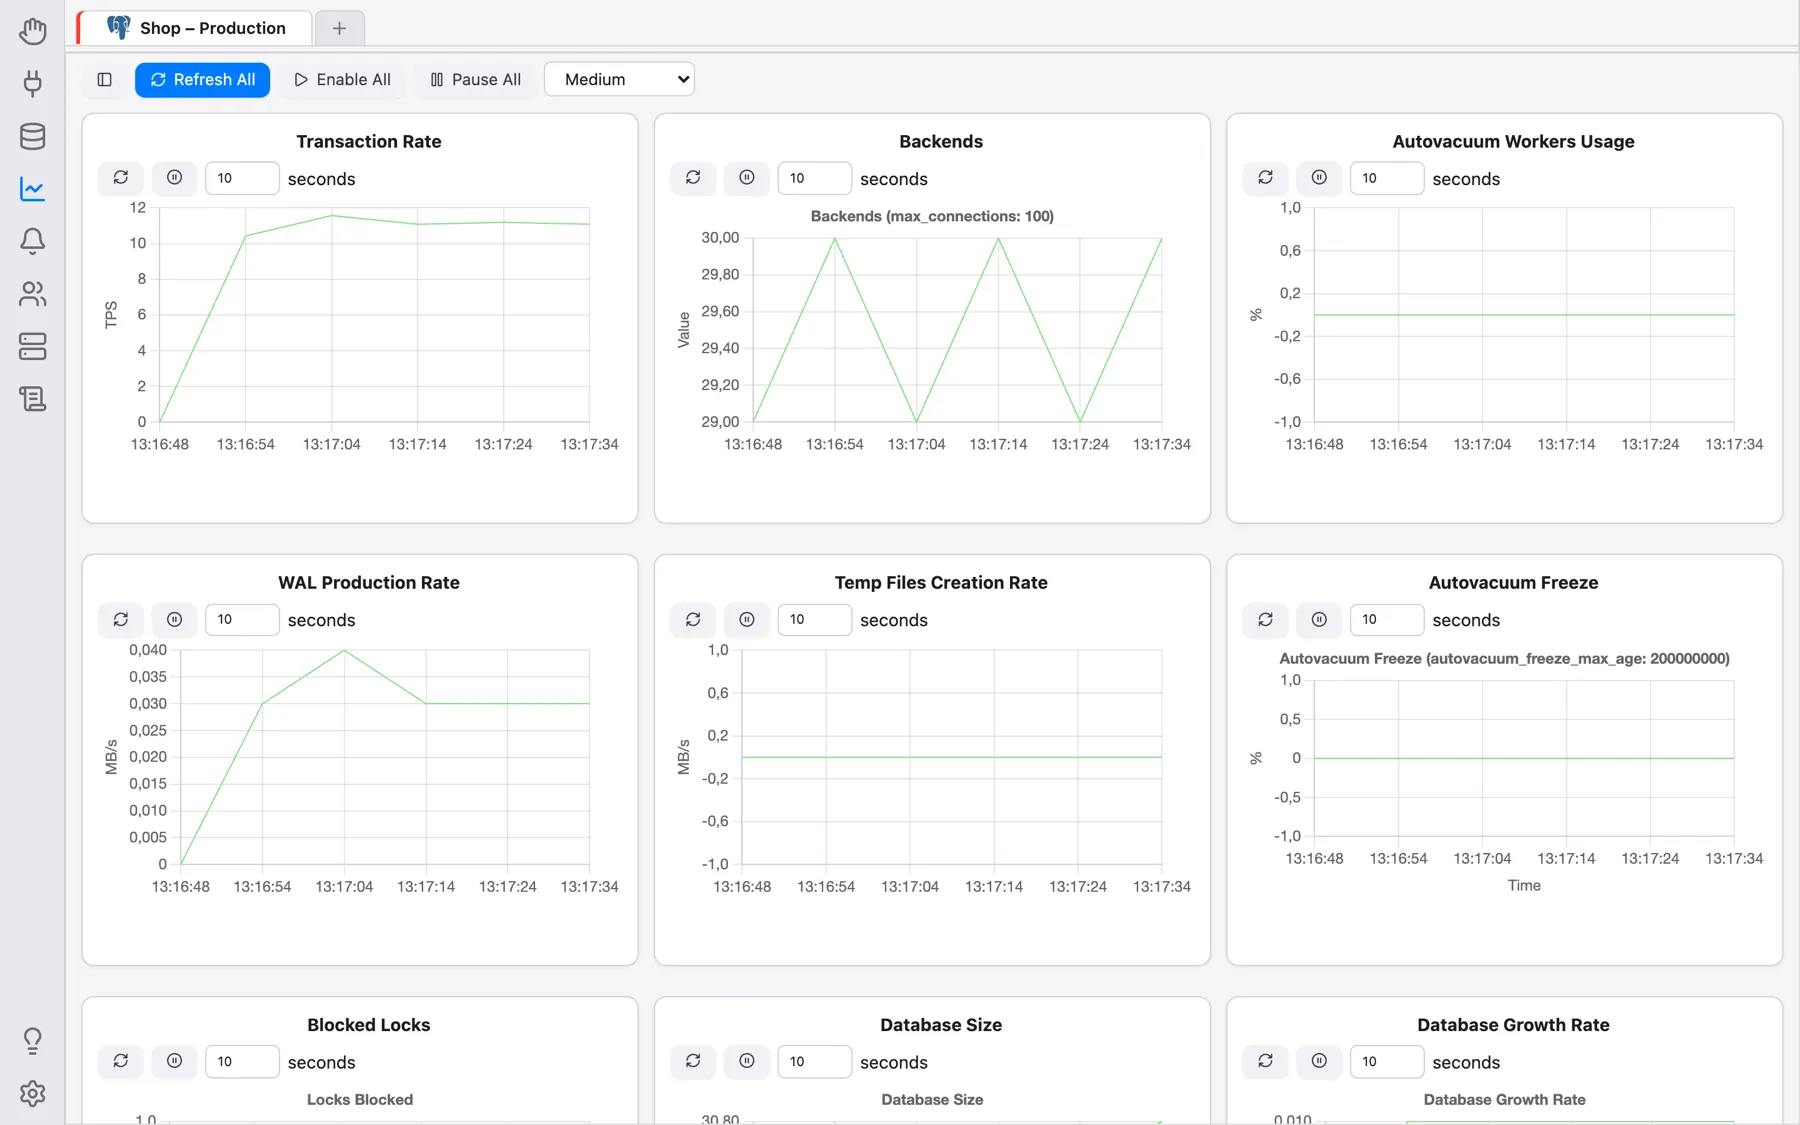
The toolbar
The toolbar at the top stays in place while the cards scroll below it:
- the first, icon-only button (tooltip Manage Units) opens or closes the unit list side panel, described below;
- Refresh All refreshes every shown unit once;
- Enable All / Pause All start or stop the automatic refresh of every unit of this connection;
- Card size — Small, Medium, Large or Full width — sets how wide a card may get before the grid wraps to fewer columns: a narrow window shows one card per row, a wide monitor several side by side. The choice is remembered in your browser.
A Monitoring Unit card
Each card has its title at the top, a × that removes (hides) the unit from the dashboard, and — for your own custom units — an edit button that opens its editor (both appear when you hover the card). Below the title are the unit's controls: refresh now, pause / play, and the refresh interval in seconds. The rest of the card is the unit's chart or grid.
A unit is one of three types:
- Grid: runs its query on each refresh and shows the result as a data grid.
- Chart (No Append): redraws a complete chart on each refresh; the previous values are replaced. Best for pie or doughnut charts of a current state.
- Timeseries: appends a new set of values to its chart on each refresh, keeping the most recent points, so you can watch a value develop over time. All built-in units are timeseries.
Managing units
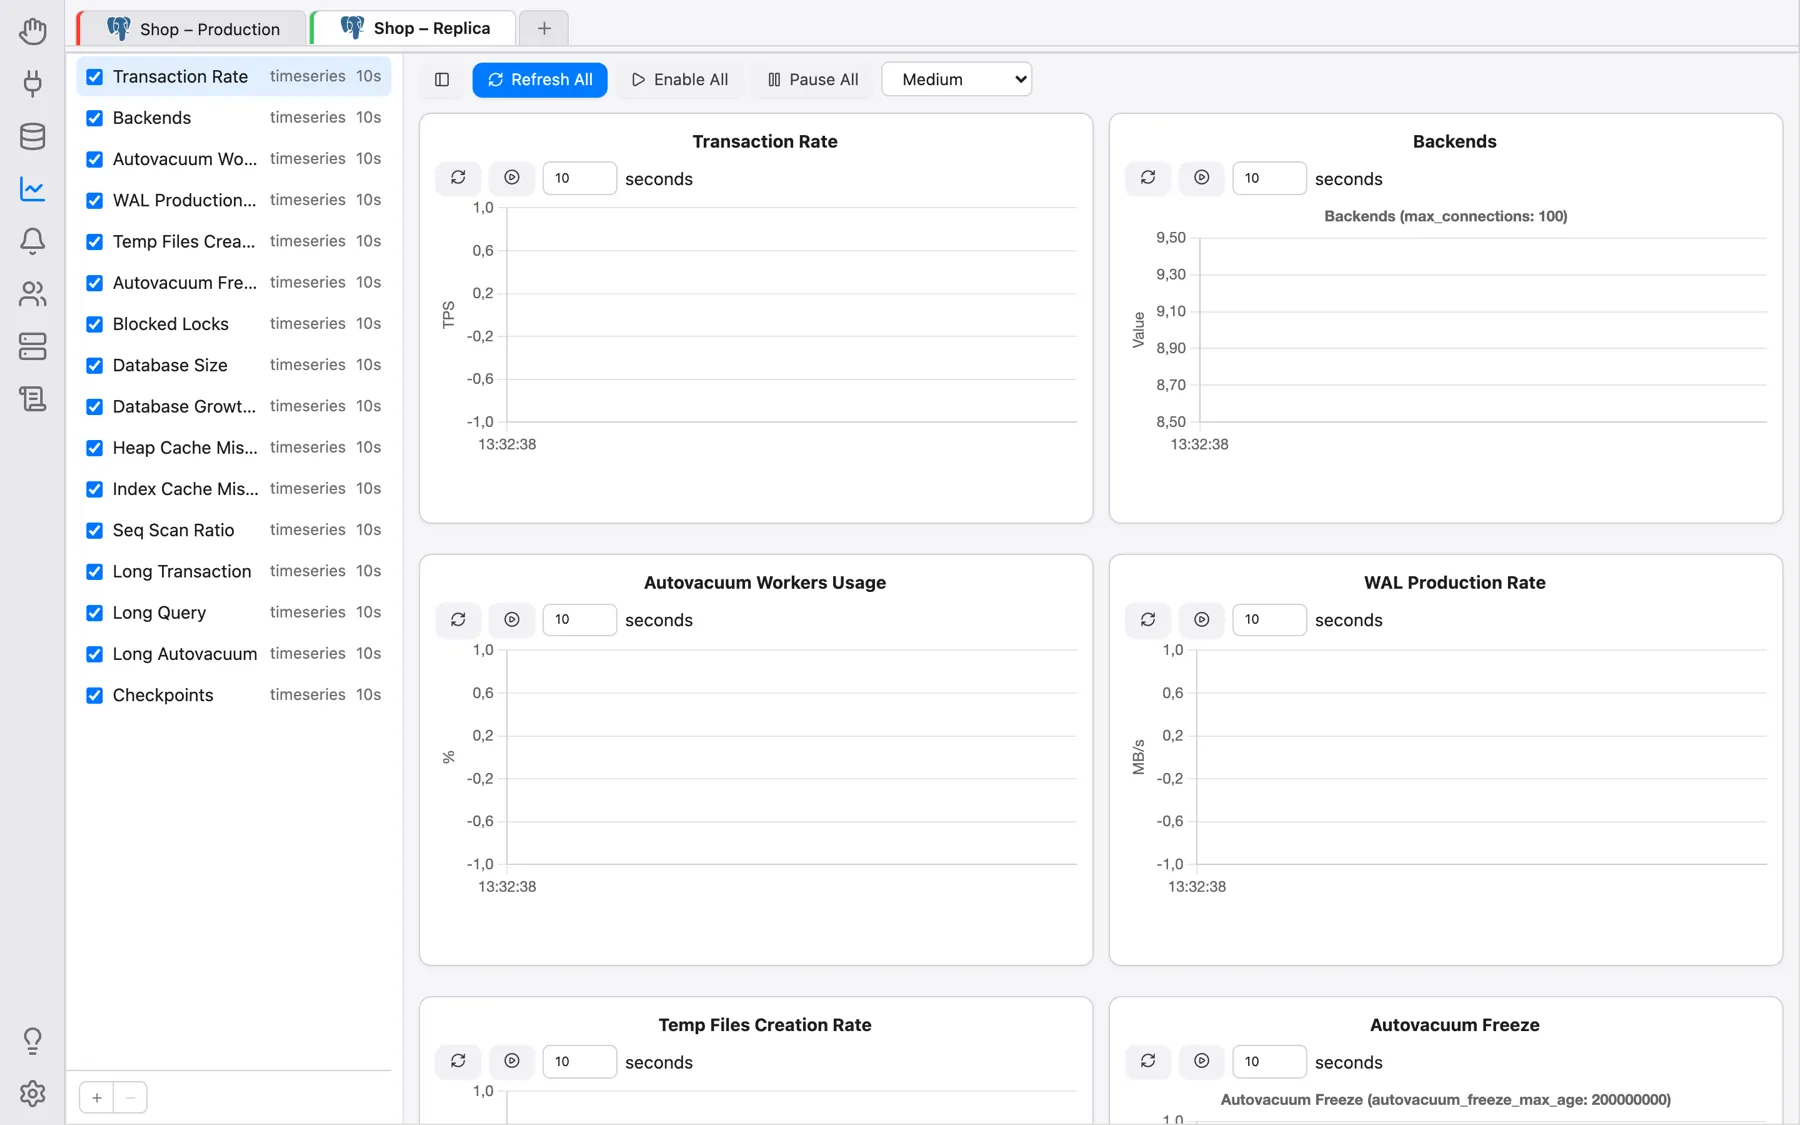
The Manage Units side panel (toggled by the toolbar's first button, and resizable by dragging its edge) lists every unit available for the connection:
- the checkbox in front of a unit shows or hides it on the dashboard (hiding stops it, the same as its card's ×, but keeps its refresh interval for next time);
- drag a row up or down to change the order of the cards on the dashboard;
- the + below the list opens the New Unit editor;
- for a custom unit, right-click → Edit or Delete, or double-click it to open its editor. Built-in units cannot be edited or deleted, only shown or hidden.
Your custom units are private to your OmniDB user.
Built-in units
PostgreSQL: Transaction Rate, Backends, Autovacuum Workers Usage, WAL Production Rate, Temp Files Creation Rate, Autovacuum Freeze, Blocked Locks, Database Size, Database Growth Rate, Heap Cache Miss Ratio, Index Cache Miss Ratio, Seq Scan Ratio, Long Transaction, Long Query, Long Autovacuum and Checkpoints. MySQL: Thread Count. They need nothing extra installed in the database.
Writing custom Monitoring Units
A custom unit is a single SQL query that runs on a timer — with the same connection and permissions your SQL editor has. There is no separate scripting language to learn.
Note: since the query re-runs unattended, only SELECT (or
WITH ... SELECT) queries are accepted — a destructive statement pasted in by mistake
is rejected outright rather than silently firing on a timer.
Click + in the Manage Units panel. A Monitor Unit editor tab opens with the fields Name, Type (Timeseries, Chart (No Append) or Grid), Refresh Interval (seconds), Template (optionally start from an existing unit), Chart Type (Bar, Pie, Doughnut or Line; shown for Chart (No Append) only) and the SQL Query editor.
The query's shape depends on the unit's type:
-
Grid: no particular shape — whatever columns and rows the query returns become the grid. For example:
SELECT * FROM pg_stat_activity -
Chart (No Append): one row per category — the first column is the label, the remaining column(s) are one series each (the column name becomes the series name). For example, a pie chart of database sizes:
SELECT datname, round(pg_catalog.pg_database_size(datname) / 1048576.0, 2) AS size_mb FROM pg_catalog.pg_database WHERE datname NOT IN ('template0', 'template1') -
Timeseries: exactly one row — each numeric column becomes one continuously-appended series. For example, tracking the total database size over time:
SELECT round(sum(pg_catalog.pg_database_size(datname)) / 1048576.0, 2) AS total_size_mb
FROM pg_catalog.pg_database
WHERE NOT datistemplate
Click Test to run the query once and see the result rendered below the editor — as many times as you like. When you are happy with it, give the unit a name, set the refresh interval and click Save. The unit then appears in the Manage Units list; tick it to show it on the dashboard.